Image Details
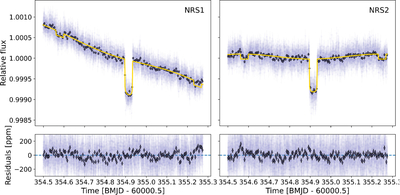
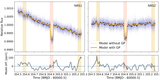
Caption: Figure 1.
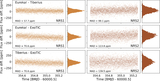
The white light phase curve of TOI-1685 b from 2.844 to 3.715 μm (NRS1, left column) and 3.823 to 5.172 μm (NRS2, right column) from JWST. Top: data from the Eureka! reduction (purple) and planet flux model fit to the data (gold). Bottom: residuals of the fit. Circles show binned data every 25 integrations to improve visualization.
Other Images in This Article
Show More
Copyright and Terms & Conditions
© 2025. The Author(s). Published by the American Astronomical Society.
Copyright ©
2025 Astronomy Image Explorer. All Rights Reserved.