Image Details
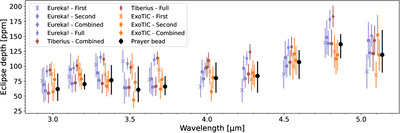
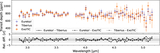
Caption: Figure 5.
Emission spectrum of TOI-1685 b using NIRSpec/G395H. Different data reductions follow the same color convention as Figure 4. Different symbols show different parts of the time series used in the fit as described in Section 3.2. Black circles represent the final emission spectrum from the prayer-bead analysis carried out in Section 3.3.3. The different data sets are offset slightly in wavelength to improve visualization.
Other Images in This Article
Show More
Copyright and Terms & Conditions
© 2025. The Author(s). Published by the American Astronomical Society.
Copyright ©
2025 Astronomy Image Explorer. All Rights Reserved.