Image Details
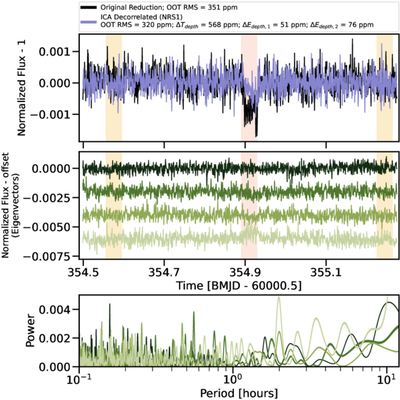
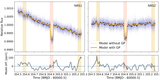
Caption: Figure 7.
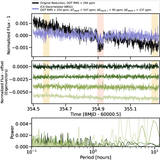
Results of the ICA for NRS2. We created 46 independent eigenvectors using the FastICA functionality in scikit-learn. We show the results for a single spectroscopic channel (λcen = 4.143 ± 0.017). Top: black is the reduced spectroscopic light curve. Purple is the light curve after it has been decorrelated against the four “best” eigenvectors, which are shown in the middle panel. The light curves are binned into 1 minute increments for ease of comparison. Bottom: results of the Lomb–Scargle periodogram on the four eigenvectors in the middle plot. Colors correspond to the appropriate eigenvector. As noted in the caption, through the ICA decorrelation, we decrease the OOT noise from 354 to 238 ppm. We defined the OOT regions as t = [(354.63, 354.85), (355.00, 355.20)] in units of BMJD 60000.5. We also note that even though there are little to no residuals of the transit and eclipses in the eigenvectors, the transit (orange-shaded region) and eclipse (yellow-shaded regions) depths change by 72, 4, and 135 ppm, respectively. The PCA eigenvectors behaved similarly. We conclude that while ICA and PCA can be used to remove similar systematics between light curves, it is best to proceed with caution when applying this technique to chromatic data sets.
Other Images in This Article
Show More
Copyright and Terms & Conditions
© 2025. The Author(s). Published by the American Astronomical Society.