Image Details
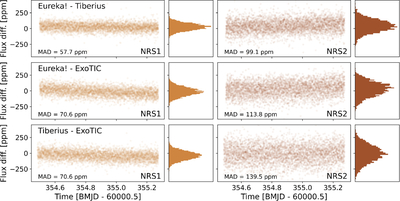
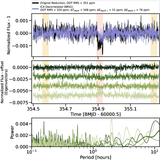
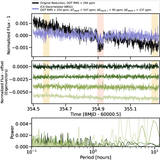
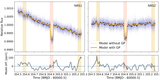
Caption: Figure 6.
Difference between the white light curves from each data reduction. Each panel shows the MAD of the data. Apart from the presence of a small linear trend (−34 ppm day−1 in NRS1 and 64 ppm day−1 in NRS2), the differences follow a Gaussian distribution, indicating that the presence and properties of correlated noise are pipeline-independent.
Other Images in This Article
Show More
Copyright and Terms & Conditions
© 2025. The Author(s). Published by the American Astronomical Society.
Copyright ©
2025 Astronomy Image Explorer. All Rights Reserved.