Image Details
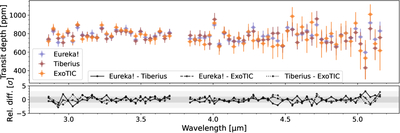
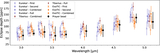
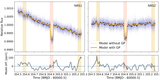
Caption: Figure 4.
Transmission spectrum of TOI-1685 b using NIRSpec/G395H. Top: individual transmission spectrum from the Eureka! (purple), Tiberius (red), and ExoTIC-JEDI (orange) data reductions. Bottom: Difference between each data reduction in units of their standard deviation.
Other Images in This Article
Show More
Copyright and Terms & Conditions
© 2025. The Author(s). Published by the American Astronomical Society.
Copyright ©
2025 Astronomy Image Explorer. All Rights Reserved.