Image Details
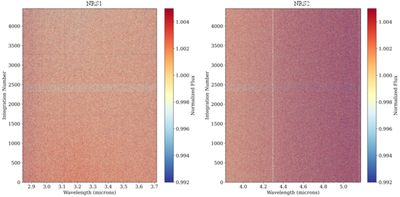
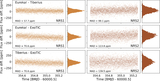
Caption: Figure 16.
Eureka! reduced spectroscopic light curves in the wavelength-integration plane for NRS1 (left) and NRS2 (right). The planet transit can be seen by eye at around integration number 2400. The two white vertical lines in NRS2 are masked bad columns. The color gradient in NRS2 is a consequence of the decreasing signal to noise as a function of wavelength in this detector. The same effect is seen in the blue end of NRS1, but much less noticeable.
Other Images in This Article
Show More
Copyright and Terms & Conditions
© 2025. The Author(s). Published by the American Astronomical Society.
Copyright ©
2025 Astronomy Image Explorer. All Rights Reserved.