Image Details
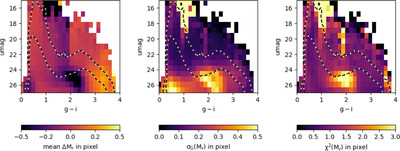
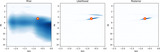
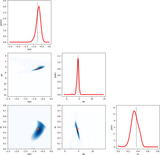
Caption: Figure 12.
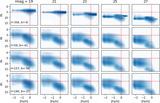
Statistical performance analysis for the estimates of model parameter Mr (absolute magnitude), as a function of observed u-band magnitude and the g − i color, for the same simulated sample as shown in Figure 11. The left column shows the mean difference per pixel between the true and estimated values, the middle column shows scatter per pixel, and the right column shows the scatter normalized by the estimated uncertainties (χ2). Contours visualize the sample distribution in each diagram. Note that for main-sequence stars Mr > 4 and for most stars 4 < Mr < 10.
Other Images in This Article
Show More
Copyright and Terms & Conditions
© 2025. The Author(s). Published by the American Astronomical Society.
Copyright ©
2026 Astronomy Image Explorer. All Rights Reserved.