Image Details
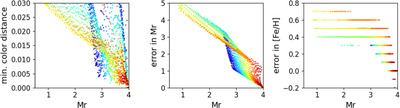
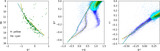
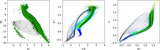
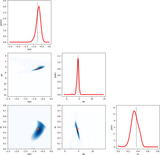
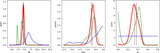
Caption: Figure 4.
Analysis of color degeneracies between giants and main-sequence stars. The left panel shows minimum color distance in four-dimensional color space (u − g, g − r, r − i, and i − z) between a position on the locus with Mr < 4 (giants) and any position on the main-sequence Mr > 4 locus (in magnitudes). Symbols are color coded by metallicity, linearly from blue to red for the range −2.5 to 0.5. The middle and right panels show errors in absolute magnitude and metallicity when a giant is misidentified as a main-sequence star closest to it in color space.
Other Images in This Article
Show More
Copyright and Terms & Conditions
© 2025. The Author(s). Published by the American Astronomical Society.
Copyright ©
2026 Astronomy Image Explorer. All Rights Reserved.