Image Details
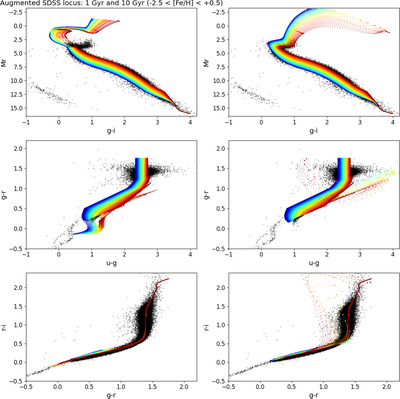
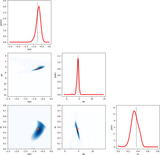
Caption: Figure 3.
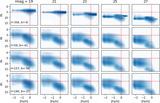
Augmented SDSS color tracks for two isochrone ages (left: 1 Gyr; right: 10 Gyr) and the full metallicity range (−2.5 < [Fe/H] < +0.5, color coded linearly from blue to red). The black dots show the same sample of 63,000 stars from the middle panel in Figure 2. As can be seen in the top right panel, subgiant stars that could not be fit with empirical SDSS-based tracks (see the middle panel in Figure 2) can be explained with tracks for old stars and intermediate-range metallicity. The sharp feature protruding from the main locus in the middle two panels corresponds to most luminous and evolved high-metallicity stars. Note that diagrams in the bottom row, which do not include the u band, show very little dependence on metallicity.
Other Images in This Article
Show More
Copyright and Terms & Conditions
© 2025. The Author(s). Published by the American Astronomical Society.