Image Details
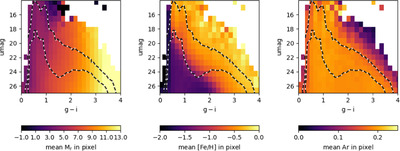
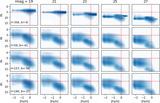
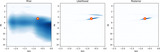
Caption: Figure 11.
The mean per-pixel values of absolute magnitude Mr, metallicity [Fe/H], and interstellar dust extinction along the line of sight in the r band, Ar, for a TRILEGAL-simulated sample of 280,000 main-sequence and red giants stars with r < 26, u < 27, 340° < R.A. < 350°, and −1﹩\mathop{.}\limits^{\unicode{x000b0}}﹩3 < δ < 1﹩\mathop{.}\limits^{\unicode{x000b0}}﹩3 (a small patch from the SDSS Stripe 82 region) in the u vs. g − i color–magnitude diagram. The mean values are color coded according to the legend below each panel. Contours visualize the sample distribution in each diagram. The strong variation of Mr with the g − i color is seen in the left panel, except for the small patch with u < 16.5 and 1.0 < g − i < 1.5 where red giant stars dominate. The diagonal iso-metallicity boundaries in the middle panel closely correspond to distance (in the range from about 1 kpc to about 100 kpc in the lower left corner). The values of dust extinction, shown in the right panel, are not large (<0.2) because the selected field is at high Galactic latitudes (centered on b = −52°).
Other Images in This Article
Show More
Copyright and Terms & Conditions
© 2025. The Author(s). Published by the American Astronomical Society.