Image Details
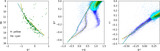
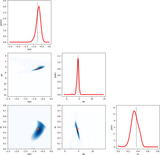
Caption: Figure 2.
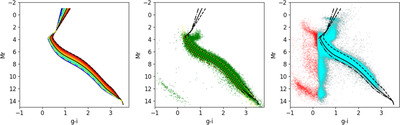
The left panel shows SDSS-based empirical absolute magnitude vs. color parameterization for main-sequence stars and red giants. The data are color coded by metallicity, ranging from [Fe/H] = −2.5 to 0 (blue to red). The three lines correspond to three values of metallicity: [Fe/H] = −2, −1, and 0 (dotted–dashed, solid, and dashed, respectively). The middle panel shows a sample of 63,000 stars that have a signal-to-noise ratio for Gaia's parallax measurements of at least 20 (WDs can be seen in the lower left corner). Their absolute magnitudes are derived from parallax measurements. The dotted–dashed, solid, and dashed black lines are the same as in the left panel. For comparison, the essentially identical yellow dotted lines were computed using Equations (A2) and (A7) from Ž. Ivezić et al. (2008). Note the discrepancy between these parameterizations and data for subgiant stars (Mr ~ 3−4 and g − i ~ 0.8−1.1). The right panel shows a sample of 415,000 stars with r < 22 and u < 22 as red dots (shown by blue dots in Figure 1), and 409,000 of those that also have 0.2 < g − i < 3.5 as cyan dots. Their absolute magnitudes were computed using the so-called “photogeometric” distances from C. A. L. Bailer-Jones et al. (2021). The dotted–dashed, solid, and dashed black lines are the same as in the left and middle panels. About 10,000 stars below the main sequence (about 2.5% of the full sample) seen at g − i = 0.4 and Mr > 7 are predominantly found at the faint end (r > 20) and may be outliers due to the low photometric signal-to-noise ratio.
Other Images in This Article
Show More
Copyright and Terms & Conditions
© 2025. The Author(s). Published by the American Astronomical Society.