Image Details
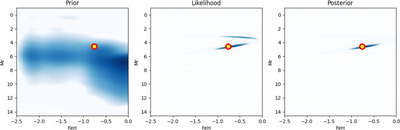
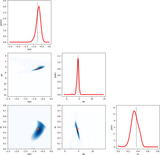
Caption: Figure 8.
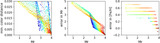
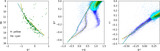
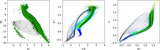
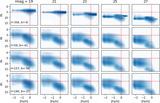
Maps of the prior (left), likelihood (middle; computed using Equation (6)), and posterior (right; computed using Equation (3)) for a simulated main-sequence star with r = 21.2, (g − r) = 0.48, Mr = 4.58, [Fe/H] = −0.76, and Ar = 0.37. The prior in the Ar direction is uniform. The circles mark the values of the input Mr and [Fe/H]. The posterior marginal distributions for all three model parameters are shown in Figure 9.
Other Images in This Article
Show More
Copyright and Terms & Conditions
© 2025. The Author(s). Published by the American Astronomical Society.
Copyright ©
2026 Astronomy Image Explorer. All Rights Reserved.