Image Details
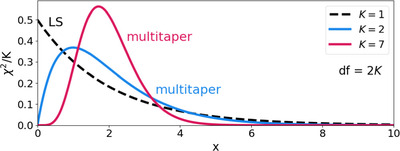
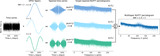
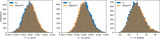
Caption: Figure 8.
Comparison between distributions of LS and multitaper power spectrum estimates. LS is χ 2 distributed with degrees of freedom df = 2 as shown by the dashed line in black. mtLS and mtNUFFT are ﹩{\chi }_{2K}^{2}﹩ distributed, where K is the number of tapers. We show the K = 2 (df = 4) and K = 7 (df = 14) distributions in blue and dark pink curves. As K (or df) increases, the ﹩{\chi }_{2K}^{2}﹩ approaches a normal distribution with symmetric values around the mean, leading to better noise properties for the mtNUFFT periodogram.
Other Images in This Article
Show More
Copyright and Terms & Conditions
© 2024. The Author(s). Published by the American Astronomical Society.
Copyright ©
2026 Astronomy Image Explorer. All Rights Reserved.