Image Details
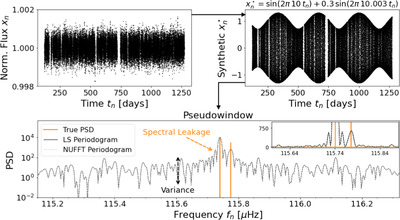
Caption: Figure 3.
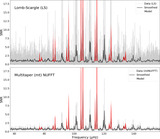
Power spectrum analysis of the pseudowindow generated using the irregular sampling times of the Kepler-91 light curve shown in the top left panel. The top right panel displays the synthetic light curve composed of two sinusoidal signals sampled at the times t n of the Kepler-91 series. The bottom panel shows a zoomed-in version of the LS (black) and NUFFT (gray) periodograms of the synthetic light curve x ⋆(t n ) as compared to the true PSD (orange). The two estimates of the true spectrum are nearly identical, and both show inconsistency and spectral leakage compared to the true PSD. Note that the bottom panel is in log scale, whereas its inset is in linear scale to better view the difference between the signals and the noise.
Other Images in This Article
Show More
Copyright and Terms & Conditions
© 2024. The Author(s). Published by the American Astronomical Society.