Image Details
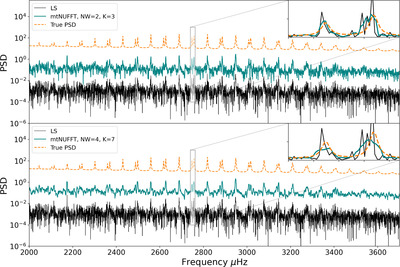
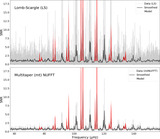
Caption: Figure 7.
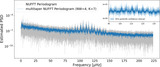
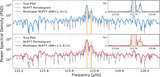
Comparison between LS, mtNUFFT, and the true spectrum used to simulate an asteroseismic time series (refer to Section 2.3 for more details of the simulation). The top and bottom panels show the NW = 3, K = 5 and NW = 4, K = 7 mtNUFFT periodograms, respectively. The insets at the top right of the two panels zoom into two p-modes; mtNUFFT is able to estimate the PSD more accurately than the LS by reducing both bias and variance. We also see that the resolution slightly reduces as we increase NW, but it does not affect mode estimation in this case.
Other Images in This Article
Show More
Copyright and Terms & Conditions
© 2024. The Author(s). Published by the American Astronomical Society.
Copyright ©
2026 Astronomy Image Explorer. All Rights Reserved.