Image Details
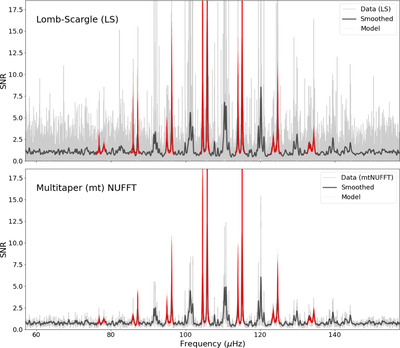
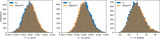
Caption: Figure 10.
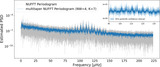
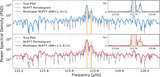
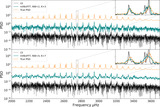
PBjam peakbagging fit for the Kepler-91 time series using the LS (top panel) and mtNUFFT (bottom panel) periodograms. Both panels show an SNR power spectrum estimate (data) in gray along with its smoothed version using a 1D Gaussian filter kernel in black. The panels also show the model fits (red) to the radial l = 0 and quadrupole l = 2 modes obtained in Step 2 of PBjam. It is evident that the variance of the mtNUFFT SNR power spectrum estimate is much smaller than that of the LS periodogram, which leads to more efficient peakbagging than LS.
Other Images in This Article
Show More
Copyright and Terms & Conditions
© 2024. The Author(s). Published by the American Astronomical Society.
Copyright ©
2026 Astronomy Image Explorer. All Rights Reserved.