Image Details
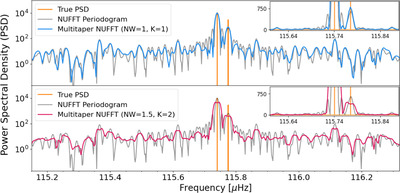
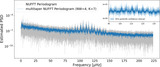
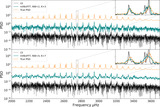
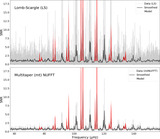
Caption: Figure 6.
Both panels show the same pseudowindow as that in the bottom panel of Figure 3, but for the NUFFT and mtNUFFT periodograms. The top panel shows the spectral leakage properties of the mtNUFFT periodogram with NW = 1 and K = 1, i.e., the single-tapered power spectrum estimate, in blue, whereas the bottom panel shows the NW = 1.5, K = 2 mtNUFFT estimate in dark pink. It is clear that the mtNUFFT estimates have smaller spectral leakage than NUFFT. In the bottom panel, we observe that as NW increases, the variance of the estimate reduces but the frequency resolution worsens.
Other Images in This Article
Show More
Copyright and Terms & Conditions
© 2024. The Author(s). Published by the American Astronomical Society.
Copyright ©
2026 Astronomy Image Explorer. All Rights Reserved.