Image Details
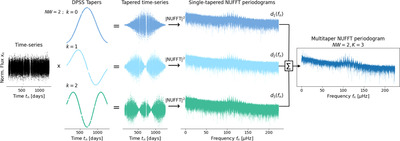
Caption: Figure 4.
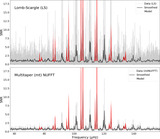
Schematic diagram illustrating the estimation of the mtNUFFT periodogram described in Section 2.2.3. The left panel shows the Kepler-91 time series for which we compute the power spectrum estimate. The middle panels show three DPSS or Slepian tapers with time-bandwidth product NW = 2 and order k = 0, 1, 2 (number of tapers K = 2NW − 1), their corresponding tapered time series, and the single-tapered NUFFT periodograms. The rightmost panel shows the multi-tapered NUFFT or mtNUFFT periodogram that is constructed by averaging the three single-tapered estimates with adaptive weights d k (f).
Other Images in This Article
Show More
Copyright and Terms & Conditions
© 2024. The Author(s). Published by the American Astronomical Society.