Image Details
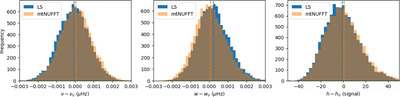
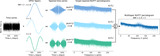
Caption: Figure 9.
Distributions of best-fit parameters for realizations from a simulated p-mode with frequency ν 0, width w 0 and height h 0. The left panel shows the deviation of the frequency estimates ν from the true value ν 0, whereas the middle and right panels show this deviation for the width and height estimates respectively. The blue and orange distributions are obtained by fitting the LS and mtNUFFT periodograms respectively, and their mean values are shown using dotted blue and orange lines. The standard deviations of the two frequency distributions in the left panel are on the order of 8 × 10⁻⁴, whereas the Libbrecht formula for the precision limit of infinite SNR p-modes is 4 × 10⁻⁴.
Other Images in This Article
Show More
Copyright and Terms & Conditions
© 2024. The Author(s). Published by the American Astronomical Society.