Image Details
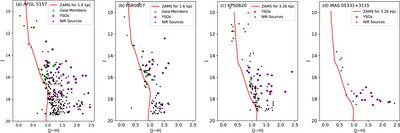
Caption: Figure 13.
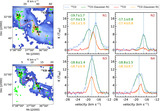
Panel (a): J vs. (J − H) CMD generated using the NIR catalog for the stars within the AFGL 5157 region. The red solid curve defines the ZAMS isochrone by Pecaut & Mamajek (2013), corrected for the distance of 1.6 kpc and A V = 2.24 mag. Panel (b): J vs. (J − H) CMD for the stars within the FSR0807 cluster. The red solid curve defines the ZAMS isochrone by Pecaut & Mamajek (2013), corrected for the distance of 1.6 kpc and zero-reddening. Panel (c): J vs. (J − H) CMD for the stars within the KPS0620 cluster. The red solid curve defines the ZAMS isochrone by Pecaut & Mamajek (2013), corrected for the distance of 3.26 kpc and A V = 2.56 mag. Panel (d): J vs. (J − H) CMD for the stars within the IRAS 05331+3115 cluster. The red solid curve defines the ZAMS isochrone by Pecaut & Mamajek (2013), corrected for the distance of 3.26 kpc and A V = 3.20 mag. The YSOs and Gaia DR3 members are marked in all the panels with magenta asterisks and green circles, respectively. Due to less detection of optical clustering, the Gaia members are not marked for KPS0620 and IRAS 05331+3115.
Other Images in This Article
Show More
Copyright and Terms & Conditions
© 2024. The Author(s). Published by the American Astronomical Society.