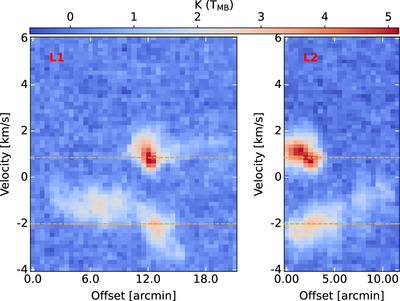
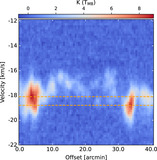
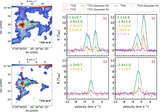
PV diagram generated using 13CO emission, along the path (red vectors) overlaid in Figure 8 for the southern molecular structure. In the direction of location S2 (see Figure 8), at least two velocity peaks are seen, which are highlighted by straight orange lines.