Image Details
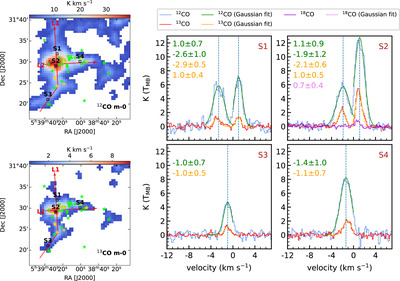
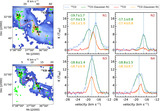
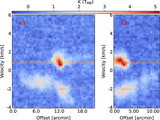
Caption: Figure 8.
Upper left panel: 12CO (J = 1 − 0) m-0, and lower left panel: 13CO (J = 1 − 0) m-0 maps overlaid with elected locations (S1—S4) to extract spectra and red colored path to extract the PV diagram in the velocity range [−4, 6] km s−1 for KPS0620 along with YSOs (Class I (yellow asterisk) and Class II (green asterisk)). Right panel: 12CO (J = 1 − 0; blue color) and 13CO (J = 1 − 0; red color) spectra at the selected locations marked in the left panel. The green and yellow curves represent the Gaussian fit/s to these spectra. The vertical dashed (blue) line represents the 12CO Gaussian fit/s peak.
Other Images in This Article

Show More
Copyright and Terms & Conditions
© 2024. The Author(s). Published by the American Astronomical Society.