Image Details
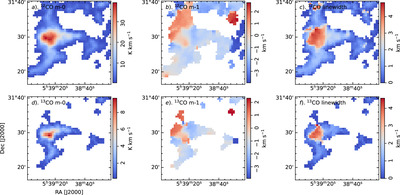
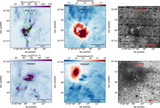
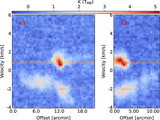
Caption: Figure 7.
m-0, m-1, and line-width maps (column-wise) for 12CO (J = 1 − 0) and 13CO (J = 1 − 0) emission, respectively, in the velocity range [−4, 6] km s−1 for KPS0620. The emission is depicted above the 5σ value (σ being the rms noise for respective spectral cubes).
Other Images in This Article

Show More
Copyright and Terms & Conditions
© 2024. The Author(s). Published by the American Astronomical Society.
Copyright ©
2026 Astronomy Image Explorer. All Rights Reserved.