Image Details
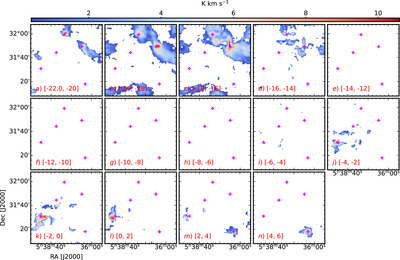
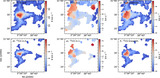
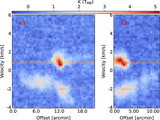
Caption: Figure 2.
Channel maps for 12CO (J = 1 − 0) emission integrated over marked velocity interval in each panel (in kilometers per second). The emission is depicted above the 5σ value (σ being the rms noise). The “+” magenta markers depict the clusters’ locations.
Other Images in This Article

Show More
Copyright and Terms & Conditions
© 2024. The Author(s). Published by the American Astronomical Society.
Copyright ©
2026 Astronomy Image Explorer. All Rights Reserved.