Image Details
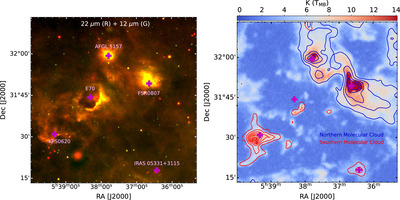
Caption: Figure 1.
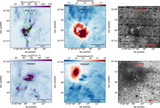
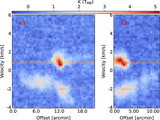
Left panel: Color-composite image (red: WISE 22 μm; green: WISE 12 μm) of present 1° × 1° target area. Right panel: 12CO peak intensity map of the selected region. The blue and red contours represent the 12CO m-0 contours for the northern and southern molecular structures/clouds, respectively (see Section 4.1). The lowest level value for both the contours is the mean value with a step size of 1σ. The locations of five sites of active star formation are also marked with a magenta “+” marker in both panels.
Other Images in This Article

Show More
Copyright and Terms & Conditions
© 2024. The Author(s). Published by the American Astronomical Society.
Copyright ©
2026 Astronomy Image Explorer. All Rights Reserved.