Image Details
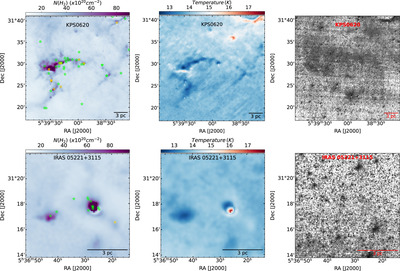
Caption: Figure 11.
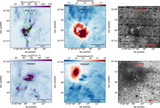
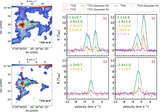
Left panels: Herschel column density map overlaid with the locations of Class I (yellow asterisk) and Class II (green asterisk) YSOs. Middle panels: Herschel temperature map. Right Panels: Spitzer ratio map (4.5 μm/3.6 μm emission) for KPS0620 (upper panels) and IRAS 05331+3115 (bottom panels).
Other Images in This Article
Show More
Copyright and Terms & Conditions
© 2024. The Author(s). Published by the American Astronomical Society.
Copyright ©
2026 Astronomy Image Explorer. All Rights Reserved.