Image Details
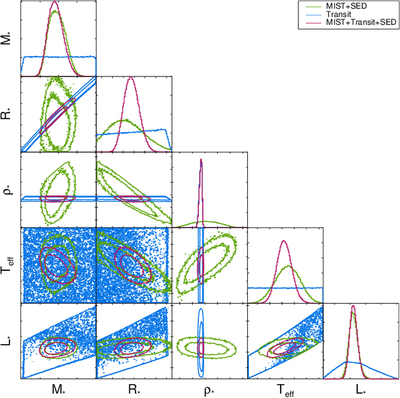
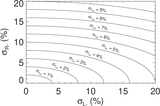
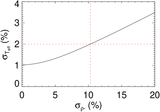
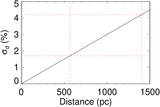
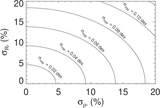
Caption: Figure 11.
A corner plot of the WASP-4 stellar parameters. The contours show the 68% and 95% confidence intervals for the MIST+SED fit (green), the transit-only fit (blue), and the MIST+transit+SED fit (magenta). From this, we can see just how the addition of the transit constrains the stellar density and significantly improves the precision of R * and T eff—to well beyond the systematic floors imposed on the SED and MIST evolutionary models. The areas under each curve in the histograms are proportional to likelihood and are normalized to have the same area between each of the fits for a given parameter. For ρ * in particular, we can see the huge impact the transit has on shifting the probability to a narrow, high peak.
Other Images in This Article
Copyright and Terms & Conditions
© 2023. The Author(s). Published by the American Astronomical Society.