Image Details
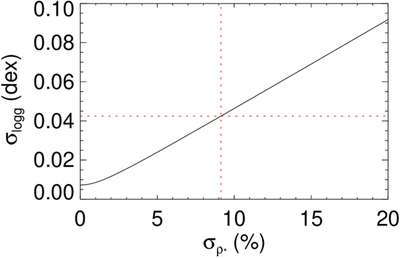
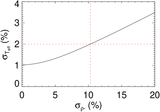
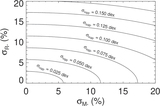
Caption: Figure 9.
A plot of ﹩{\sigma }_{\mathrm{log}{g}_{* }}﹩ as a function of ﹩{\sigma }_{\,{\rho }_{* }}﹩, assuming ﹩{\sigma }_{{M}_{* }}=5 \% ﹩. The break-even point of ﹩\mathrm{log}{g}_{* }=0.042﹩ dex, where ﹩{\sigma }_{{M}_{* }}=5 \% ﹩ and from Tayar et al. (2022), is shown as a vertical red dashed line and corresponds to ﹩{\sigma }_{\,{\rho }_{* }}\sim 9 \% ﹩.
Other Images in This Article
Copyright and Terms & Conditions
© 2023. The Author(s). Published by the American Astronomical Society.
Copyright ©
2025 Astronomy Image Explorer. All Rights Reserved.