Image Details
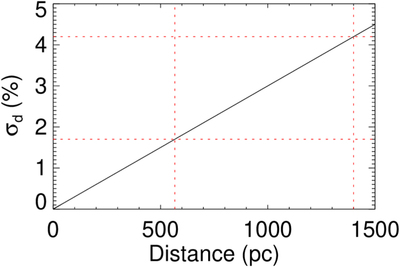
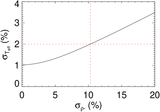
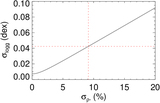
Caption: Figure 6.
A plot of the level of systematic error in Gaia as a function of distance. The black line shows a 30 μas systematic uncertainty in Gaia DR3 estimated by Lindegren et al. (2021), which dominates the luminosity systematics at ∼600 and ∼1400 pc when the R * uncertainties are at the systematic limits of 1.7% and 4.2%, respectively, marked as red dashed lines.
Other Images in This Article
Copyright and Terms & Conditions
© 2023. The Author(s). Published by the American Astronomical Society.
Copyright ©
2025 Astronomy Image Explorer. All Rights Reserved.