Image Details
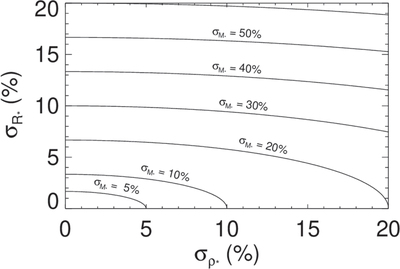
Caption: Figure 1.
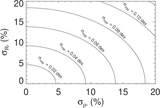
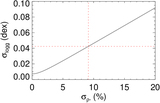
A contour plot of the percent error in M * as a function of the percent errors in ρ * and R *, derived from Equation (7). We see that the dependence on ﹩{\sigma }_{{R}_{* }}﹩ is strong, and with a typical ﹩{\sigma }_{\,{\rho }_{* }}﹩ of 10%, the resulting constraint on M * is not particularly informative. Even with no error in ρ *, the systematic floor in R * of ∼4.2% implies an error of 13% in stellar mass, which is much larger than the ∼5% presumed for masses derived from evolutionary models.
Other Images in This Article
Copyright and Terms & Conditions
© 2023. The Author(s). Published by the American Astronomical Society.