Image Details

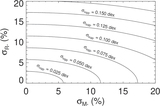
Caption: Figure 7.
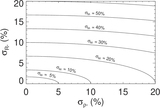
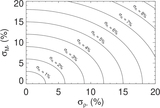
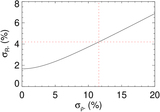
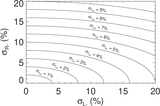
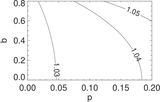
A contour plot of the error in ﹩\mathrm{log}{g}_{* }﹩ as a function of the percent errors in ρ * and R *, derived from Equation (19). A typical spectroscopic constraint is 0.1 dex. For precise values of ρ *, we can do more than an order of magnitude better.
Other Images in This Article
Copyright and Terms & Conditions
© 2023. The Author(s). Published by the American Astronomical Society.
Copyright ©
2025 Astronomy Image Explorer. All Rights Reserved.