Image Details
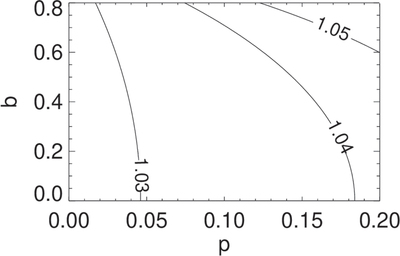
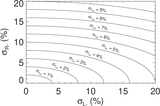
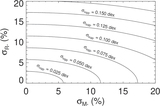
Caption: Figure 10.
A contour plot showing the maximum allowed unaccounted blend in the transit light curve as a function of impact parameter b and planet-to-star radius ratio p such that its systematic impact ρ * is below the 2% systematic impact from M *. That is, the leftmost contour shows the family of planets whose systematics on the light-curve-determined ρ * would be dominated by blends larger than 3% of the host star flux. Stated differently, as long as the unaccounted flux was less than 3%, the largest source of systematic error in the model would come from M *.
Other Images in This Article
Copyright and Terms & Conditions
© 2023. The Author(s). Published by the American Astronomical Society.