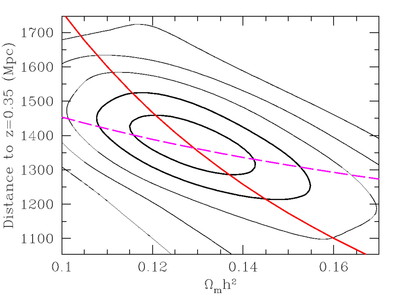
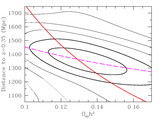
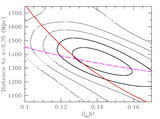
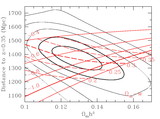
Image Details

Choose export citation format:

Detection of the Baryon Acoustic Peak in the Large‐Scale Correlation Function of SDSS Luminous Red Galaxies

  • Authors: Daniel J. Eisenstein, Idit Zehavi, David W. Hogg, Roman Scoccimarro, Michael R. Blanton, Robert C. Nichol, Ryan Scranton, Hee-Jong Seo, Max Tegmark, Zheng Zheng, Scott F. Anderson, Jim Annis, Neta Bahcall, Jon Brinkmann, Scott Burles, Francisco J. Castander, Andrew Connolly, Istvan Csabai, Mamoru Doi, Masataka Fukugita, Joshua A. Frieman, Karl Glazebrook, James E. Gunn, John S. Hendry, Gregory Hennessy, Zeljko Ivezić, Stephen Kent, Gillian R. Knapp, Huan Lin, Yeong-Shang Loh, Robert H. Lupton, Bruce Margon, Timothy A. McKay, Avery Meiksin, Jeffery A. Munn, Adrian Pope, Michael W. Richmond, David Schlegel, Donald P. Schneider, Kazuhiro Shimasaku, Christopher Stoughton, Michael A. Strauss, Mark SubbaRao, Alexander S. Szalay, István Szapudi, Douglas L. Tucker, Brian Yanny, and Donald G. York

Eisenstein et al. 2005 The Astrophysical Journal 633 560.

  • Provider: AAS Journals

Caption: Fig. 7.

Likelihood contours of CDM models as a function of Ωmh2 and DV(0.35). The likelihood has been taken to be proportional to ﹩\mathrm{exp}\,( -\chi ^{2}/ 2) ﹩, and contours corresponding to 1 through 5 σ for a two‐dimensional Gaussian have been plotted. The one‐dimensional marginalized values are ﹩\Omega _{m}h^{2}=0.130\pm 0.010﹩ and ﹩D_{V}( 0.35) =1370\pm 64﹩ Mpc. We overplot lines depicting the two major degeneracy directions. The red line is a line of constant Ωmh2DV(0.35), which would be the degeneracy direction for a pure CDM model. The magenta line is a line of constant sound horizon, holding ﹩\Omega _{b}h^{2}=0.024﹩. The contours clearly deviate from the pure CDM degeneracy, implying that the peak at 100 h−1 Mpc is constraining the fits.

Other Images in This Article

Show More

Copyright and Terms & Conditions