Image Details
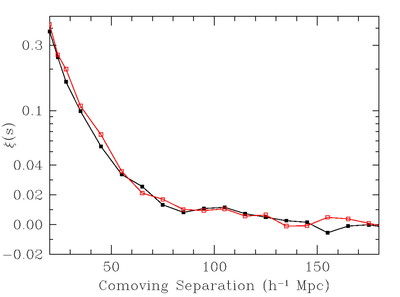
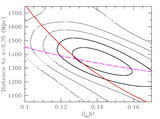
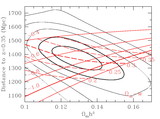
Caption: Fig. 4.
Correlation function for two different redshift slices, ﹩0.16< z< 0.36﹩ (black line) and ﹩0.36< z< 0.47﹩ (red line). The latter is somewhat noisier, but the two are quite similar and both show evidence of the acoustic peak. The differences are within the expected statistical variations, as tested by χ2. Note that the vertical axis mixes logarithmic and linear scalings.
Other Images in This Article
Show More
Copyright and Terms & Conditions
© 2005. The American Astronomical Society. All rights reserved. Printed in U.S.A.
Copyright ©
2026 Astronomy Image Explorer. All Rights Reserved.