Image Details
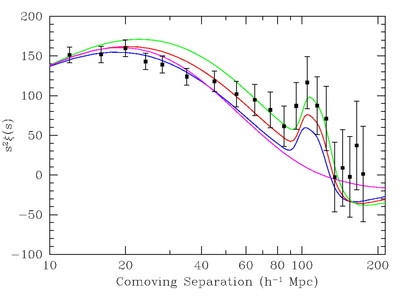
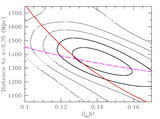
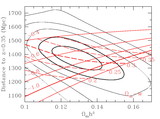
Caption: Fig. 3.
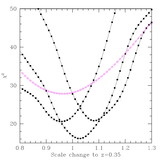
Same as Fig. 2, but plotting the correlation function times s2. This shows the variation of the peak at 20 h−1 Mpc scales that is controlled by the redshift of equality (and hence by Ωmh2). Varying Ωmh2 alters the amount of large‐to‐small scale correlation, but boosting the large‐scale correlations too much causes an inconsistency at 30 h−1 Mpc. The pure CDM model (magenta line) is actually close to the best fit due to the data points on intermediate scales.
Other Images in This Article
Show More
Copyright and Terms & Conditions
© 2005. The American Astronomical Society. All rights reserved. Printed in U.S.A.
Copyright ©
2026 Astronomy Image Explorer. All Rights Reserved.