Image Details
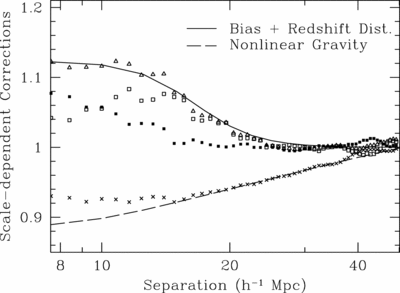
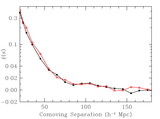
Caption: Fig. 5.
Scale‐dependent corrections derived from 51 N‐body simulations, each 512 h−1 Mpc comoving with 2563 particles (Seo & Eisenstein 2005). The crosses show the ratio between the nonlinear matter correlation function and the linear correlation function; the dashed line is the model we use from Smith et al. (2003). The solid points are the ratio of the biased correlation function (using a simple halo mass cut) to the nonlinear matter correlation function. The open squares are the ratio of the biased redshift‐space correlation function to the biased real‐space correlation function, after removing the large‐scale asymptotic value (Kaiser 1987), which we simply fold into the correlation amplitude parameter. The open triangles show the product of these two effects, and the solid line is our fit to this product. These corrections are of order 10% at 10 h−1 Mpc separations and decrease quickly on larger scales. In addition to these corrections, we mimic the erasure of the small‐scale acoustic oscillations in the power spectrum by using a smoothed crossover at ﹩k=0.14\ h\ \mathrm{Mpc}\,^{-1}﹩ between the CMBFAST linear power spectrum and the no‐wiggle form from Eisenstein & Hu (1998).
Other Images in This Article
Show More
Copyright and Terms & Conditions
© 2005. The American Astronomical Society. All rights reserved. Printed in U.S.A.