Image Details
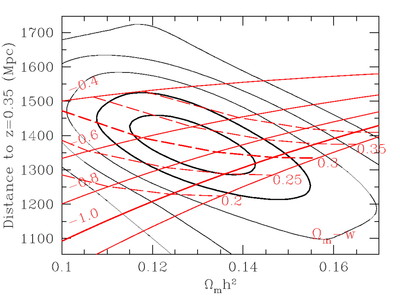
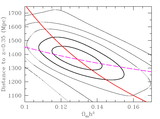
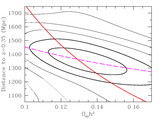
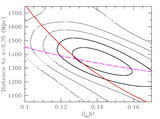
Caption: Fig. 10.
(a) Same as Fig. 7, but overplotted with model predictions from constant‐w flat models. For a given value of Ωmh2 and w, the angular scale of the CMB acoustic peaks (known to 1%) determines Ωm and H0. Of course, the required Ωm is a function of w and Ωmh2. The solid red lines show lines of constant w; the dashed red lines show lines of constant Ωm. Our knowledge of Ωmh2 still limits our inference of w. (b) Same as (a), but the dashed red lines are now lines of constant H0.
Other Images in This Article
Show More
Copyright and Terms & Conditions
© 2005. The American Astronomical Society. All rights reserved. Printed in U.S.A.
Copyright ©
2026 Astronomy Image Explorer. All Rights Reserved.