Image Details
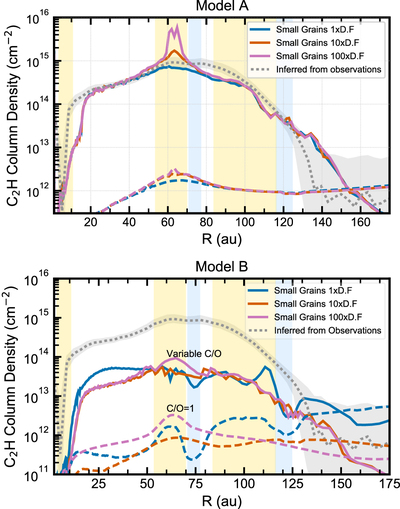
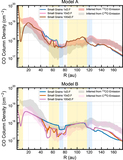
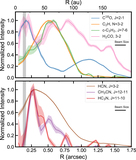
Caption: Figure 9.
C2H column-density profiles compared with the inferred values from observations. Top: simulation set for Model A. Bottom: simulation set for Model B. The shaded areas in yellow and blue are the dust gaps and dust ring, respectively. Variable C/O models are shown in continuous lines, while the dashed lines are the models with a constant C/O ratio equal to 1. Our simulations show that depleting the number of small dust grains increases the C2H column density by a factor of a few. However the main player in the C2H column density is the C/O ratio.
Other Images in This Article
Show More
Copyright and Terms & Conditions
© 2021. The American Astronomical Society. All rights reserved.
Copyright ©
2025 Astronomy Image Explorer. All Rights Reserved.