Image Details
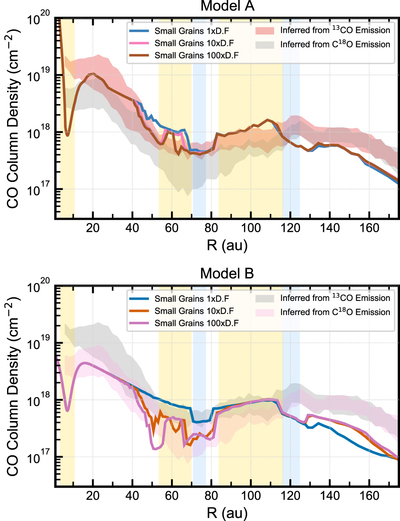
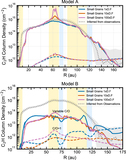
Caption: Figure 4.
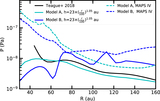
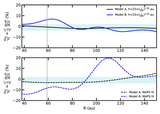
CO column-density profiles for both sets of simulations. Top: smooth gas surface density applying the CO depletion profile in Figure 2. Bottom: Simulation set with CO as a gas mass tracer. The vertical shaded areas are the location of dust substructures, while the radial shaded regions represent the CO column densities derived in Zhang et al. (2021) using 13CO and C18O emission. In both cases, Models A and B, we observe that whether including CO chemical processing or the gas depletion, they both match the recovered CO column densities. The shaded regions are the locations of the dust gaps and dust rings, in yellow and blue, respectively.
Other Images in This Article
Show More
Copyright and Terms & Conditions
© 2021. The American Astronomical Society. All rights reserved.