Image Details
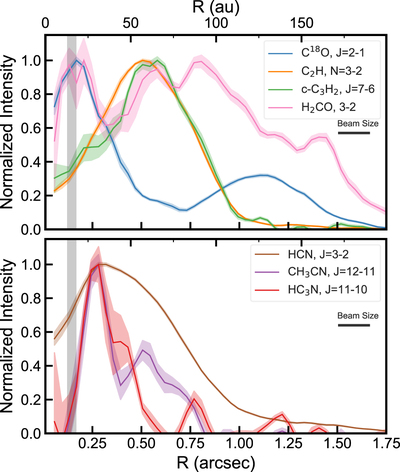
Caption: Figure 10.
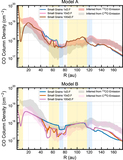
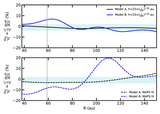
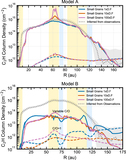
Normalized line emission of select species. Top: Radial profiles of hydrocarbons and CO. We observe a multiple peak structure within the gas gap. Bottom: Radial profiles of nitriles in AS 209. They peak close to 25 au, one of the inner continuum-emission rings. The black shaded area represents the CO ice line in the midplane.
Other Images in This Article
Show More
Copyright and Terms & Conditions
© 2021. The American Astronomical Society. All rights reserved.
Copyright ©
2025 Astronomy Image Explorer. All Rights Reserved.