Image Details
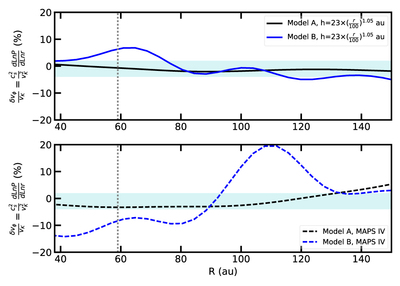
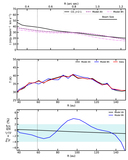
Caption: Figure 7.
Expected velocity deviations in our models inferred from the pressure profiles. We inferred the velocity deviations using the relationships described by Rosotti et al. (2020). The shaded area illustrates the range of kinematic deviations from the data (see Appendix C). In Model A the deviations are significantly smaller than in Model B. Model A does not present strong kinematic deviations from its pressure profile, while Model B with a gas gap shows deviations of the order of 10% in both surfaces.
Other Images in This Article
Show More
Copyright and Terms & Conditions
© 2021. The American Astronomical Society. All rights reserved.
Copyright ©
2025 Astronomy Image Explorer. All Rights Reserved.