Image Details
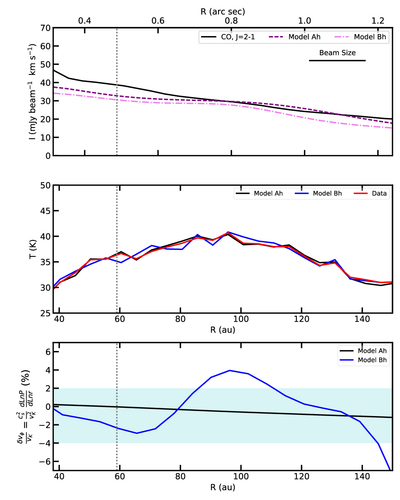
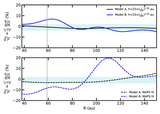
Caption: Figure 8.
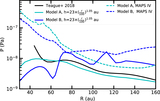
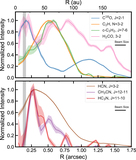
Comparison of data and expected values of thermochemical models with three iterations of hydrostatic equilibrium. Top: CO J = 2–1 emission profile. Middle: thermal cuts for both models matching the brightness temperature of the CO J = 2–1 line (Law et al. 2021a). Bottom: expected kinematic deviations in Models Ah and Bh with the range from the observations represented by the shaded area. The models show that the CO J = 2–1 is, to a small uncertainty, well traced in both cases. The kinematic deviations in Models Ah and Bh show that even when a few iterations of hydrostatic equilibrium are considered, the results stand, i.e., the kinematic deviations in Model Bh with a H2 gas depletion are stronger and cover a larger range than the ones observed in the data.
Other Images in This Article
Show More
Copyright and Terms & Conditions
© 2021. The American Astronomical Society. All rights reserved.