Image Details
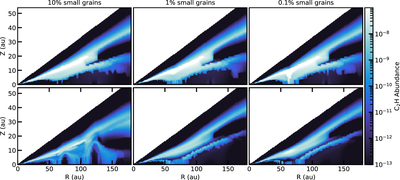
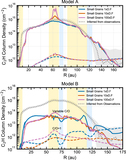
Caption: Figure 15.
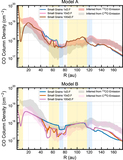
C2H 2D abundance structure in each set of simulations. Top row: C2H abundance structure for Model A. Bottom row: C2H abundance structure for Model B. In the regions where the small dust is depleted, C2H can be produced closer to the midplane. This causes the slight increases in C2H column density observed in Figure 9.
Other Images in This Article
Show More
Copyright and Terms & Conditions
© 2021. The American Astronomical Society. All rights reserved.
Copyright ©
2025 Astronomy Image Explorer. All Rights Reserved.