Image Details
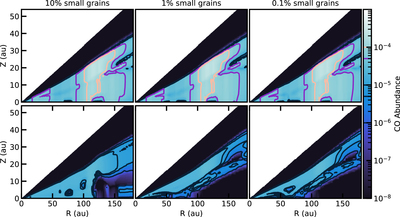
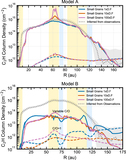
Caption: Figure 14.
CO abundance structure for both model sets, A and B, with different localized depletion factors of small grains from left to right. Top row: CO abundance structure for Model A, where CO has been depleted and the gas surface density has a smooth profile. Bottom row: CO abundance structure for Model B, where CO is considered to trace the gas surface density by a constant scaling or CO/H2 ratio. In both models, there are not significant changes with different degrees of small-grains depletion. However, we observe that in Model A, CO has a more uniform vertical distribution than in Model B.
Other Images in This Article
Show More
Copyright and Terms & Conditions
© 2021. The American Astronomical Society. All rights reserved.
Copyright ©
2025 Astronomy Image Explorer. All Rights Reserved.