Image Details
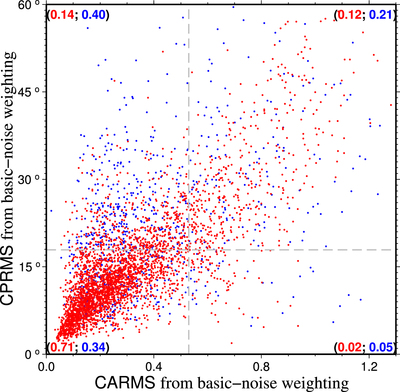
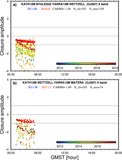
Caption: Figure 15.
Plot of CPRMS values vs. CARMS values using basic-noise weighting for 4265 sources. The 3417 sources with at least 100 closure phases and at least 100 closure amplitudes are plotted in red dots, while the remaining 848 sources are plotted in blue dots. The difference between these two distributions is investigated by using the Kolmogorov–Smirnov test, which confirms that they are statistically different from each other. The test identifies the point with a CARMS value of 0.53 and a CPRMS value of 17.°9, which defines the four natural quadrants, represented by the two gray dashed lines, to give the largest difference between the distributions of red dots and blue dots. The frequencies of occurrences of the red dots and blue dots in each of four quadrants are displayed in the four corners with their corresponding colors. The CARMS values are recommended for astrometric use, and the CPRMS values for the cross-check.
Other Images in This Article

Show More
Copyright and Terms & Conditions
© 2019. The American Astronomical Society.