Image Details
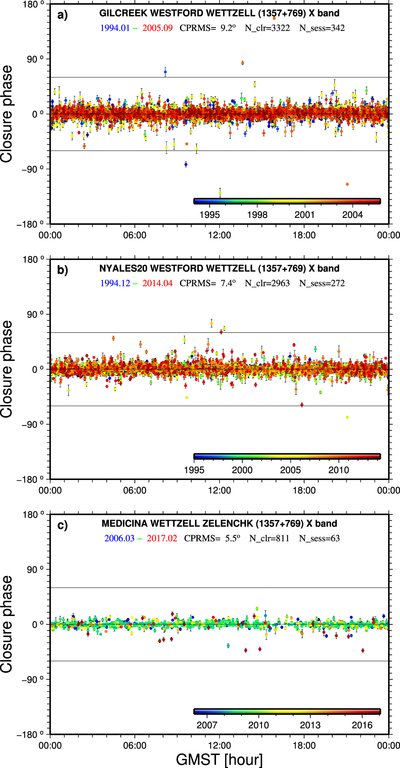
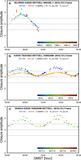
Caption: Figure 1.
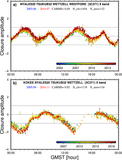
Plots of closure phases at the X band for source 1357+769 as a function of GMST for three triangles, (a) GILCREEK–WESTFORD–WETTZELL, (b) TSUKUB32–WESTFORD–WETTZELL, and (c) MEDICINA–SVETLOE–WETTZELL. Closure phase uncertainties are shown as black bars. The color coding indicates the observing date of the closure measurement, and the corresponding legend is shown on the bottom-right corner of each plot. The station names in the sequence of forming the triangle are shown in the first row of the top. Several statistics for the closure phases of that triangle are shown in the second row: the starting date and the ending date of observations in the format of year and month, the CPRMS value using uniform weighting, the number of closure phases N_clr, and the number of sessions N_sess. For instance, the triangle GILCREEK–WESTFORD–WETTZELL has 3322 closure phases in 342 sessions with a CPRMS value of 9.°2 during its entire observing period of 1994-01 to 2005-09. The thin horizontal black lines at 0°, −60°, and 60° are shown to guide the reading of the variation magnitudes of closure phases. These three plots demonstrate well the minimal structure of source 1357+769 over 20 yr. In particular, plot c implies the good case of the thermal noise level in geodetic baseline phase observables, which is about 3.°1.
Other Images in This Article

Show More
Copyright and Terms & Conditions
© 2019. The American Astronomical Society.