Image Details
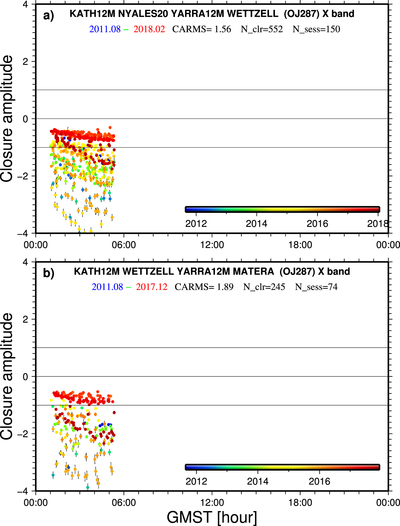
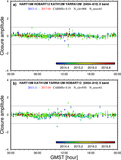
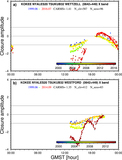
Caption: Figure 9.
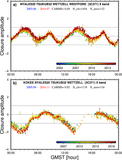
Plots of closure amplitudes at the X band for source 0851+202 (OJ 287) as a function of GMST for two quadrangles, (a) KATH12M–NYALES20–YARRA12M–WETTZELL and (b) KATH12M–WETTZELL–YARRA12M–MATERA. See Figure 5 for a description of the plot design. The magnitudes of the structure effect on closure amplitudes evolved within 6 yr from 0.5 to 4 two times and from 0.5 to 2 several times. The timescale of the evolution is less than 1 yr. Very extended structure is detected.
Other Images in This Article

Show More
Copyright and Terms & Conditions
© 2019. The American Astronomical Society.
Copyright ©
2025 Astronomy Image Explorer. All Rights Reserved.