Image Details
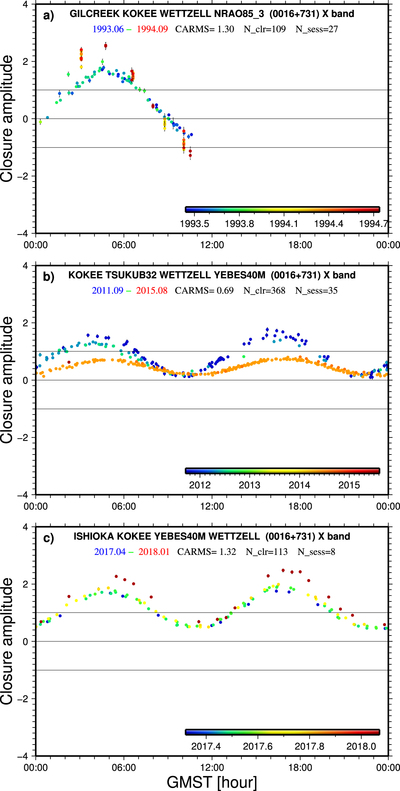
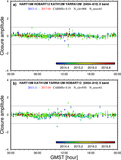
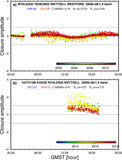
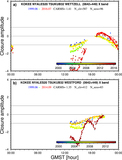
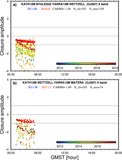
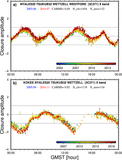
Caption: Figure 6.
Plots of closure amplitudes at the X band of source 0016+731 as a function of GMST for three quadrangles, (a) GILCREEK–KOKEE–WETTZELL–NRAO85_3, (b) KOKEE–TSUKUB32–WETTZELL–YEBES40M, and (c) ISHIOKA–KOKEE–YEBES40M–WETTZELL. See Figure 5 for a description of the plot design. The structure-effect patterns in plots b and c can simply be combined because ISHIOKA and TSUKUB32 are two stations at the same site. The evolution of its structure effects is seen from the three plots.
Other Images in This Article

Show More
Copyright and Terms & Conditions
© 2019. The American Astronomical Society.
Copyright ©
2025 Astronomy Image Explorer. All Rights Reserved.