Image Details
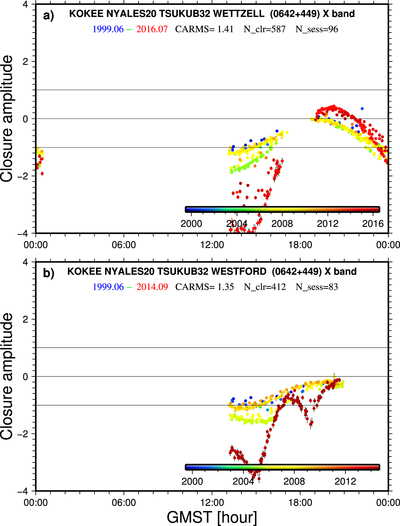
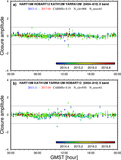
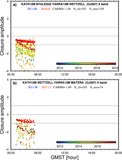
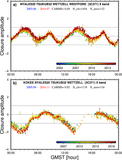
Caption: Figure 8.
Plots of closure amplitudes at the X band for source 0642+449 as a function of GMST for two quadrangles, (a) KOKEE–NYALES20–TSUKUB32–WETTZELL and (b) KOKEE–NYALES20–TSUKUB32–WESTFORD. See Figure 5 for a description of the plot design. Its structure has dramatically evolved several times. The largest magnitude of closure amplitude in plot a is −4, so that the ratio of the observed amplitudes of the four baselines was less than e−4 (∼0.04). The closure amplitude patterns change very rapidly with respect to GMST in plot b. A very extended structure is detected.
Other Images in This Article

Show More
Copyright and Terms & Conditions
© 2019. The American Astronomical Society.
Copyright ©
2025 Astronomy Image Explorer. All Rights Reserved.