Image Details
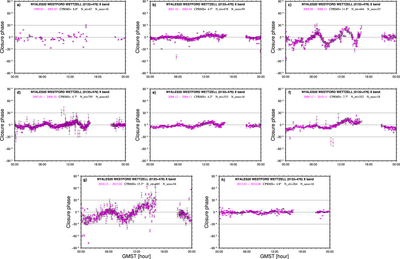
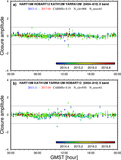
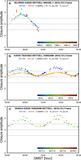
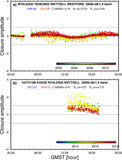
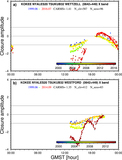
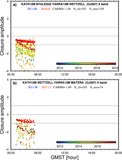
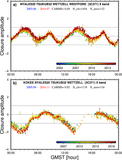
Caption: Figure 2.
Plots of closure phases at the X band for source 0133+476 as a function of GMST for triangle NYALES20–WESTFORD–WETTZELL. The 15 yr history of closure phase measurements for this triangle is divided into eight segments according to the different well-identified structure-effect patterns. They are therefore shown in eight separate plots in order to keep the patterns with small magnitudes from overlapping with each other. See Figure 1 for a description of the plot design except the color coding, which is not used in this figure. The time evolution of the structure effects for this triangle can be easily seen, which suggests changes in the source structure of 0133+476 although it was relatively compact. As we can see from these plots, the patterns changed in terms of the magnitudes of the peaks but not the GMST epochs of the peaks in these eight plots. The peak magnitudes changed, both decreasing and increasing, which suggests that the evolution of the closure patterns are caused by the changes in the flux density ratio of its jet to the core. The scatter of the closure phases along the pattern in the time period of 2010-12 to 2013-02, shown in plot g, is significantly larger than in other periods of time. One can infer that its core was more strongly resolved in 2010-12 to 2013-02.
Other Images in This Article
Show More
Copyright and Terms & Conditions
© 2019. The American Astronomical Society.